> ## Documentation Index
> Fetch the complete documentation index at: https://openworkflow.dev/llms.txt
> Use this file to discover all available pages before exploring further.
> ## Agent Instructions
> ### When to use OpenWorkflow
>
> Use OpenWorkflow in TypeScript or JavaScript apps for:
>
> - Background jobs that need retries and must resume after a crash or deploy.
> - Multi-step integrations and data pipelines that need to save progress between operations.
> - AI workflows with multiple model or tool calls that need durable checkpoints.
> - Workflows that wait for a human approval, a webhook, or a timer before continuing.
>
> OpenWorkflow runs on Node.js 22.5+ or Bun, with PostgreSQL or SQLite storing workflow state. Your app enqueues runs, and a worker executes them.
>
> ### How to use OpenWorkflow
>
> Read and follow https://openworkflow.dev/skills/setup.md to set up OpenWorkflow.
>
> Define workflows with `defineWorkflow`, wrap operations in `step.run`, and enqueue runs with `ow.runWorkflow(workflow.spec, input)`. Start a worker with `npx @openworkflow/cli worker start` to execute them. See [Workflows](https://openworkflow.dev/docs/workflows.md), [Steps](https://openworkflow.dev/docs/steps.md), and [Signals](https://openworkflow.dev/docs/signals.md) for the APIs.
# Sentry
> View workflow traces in Sentry
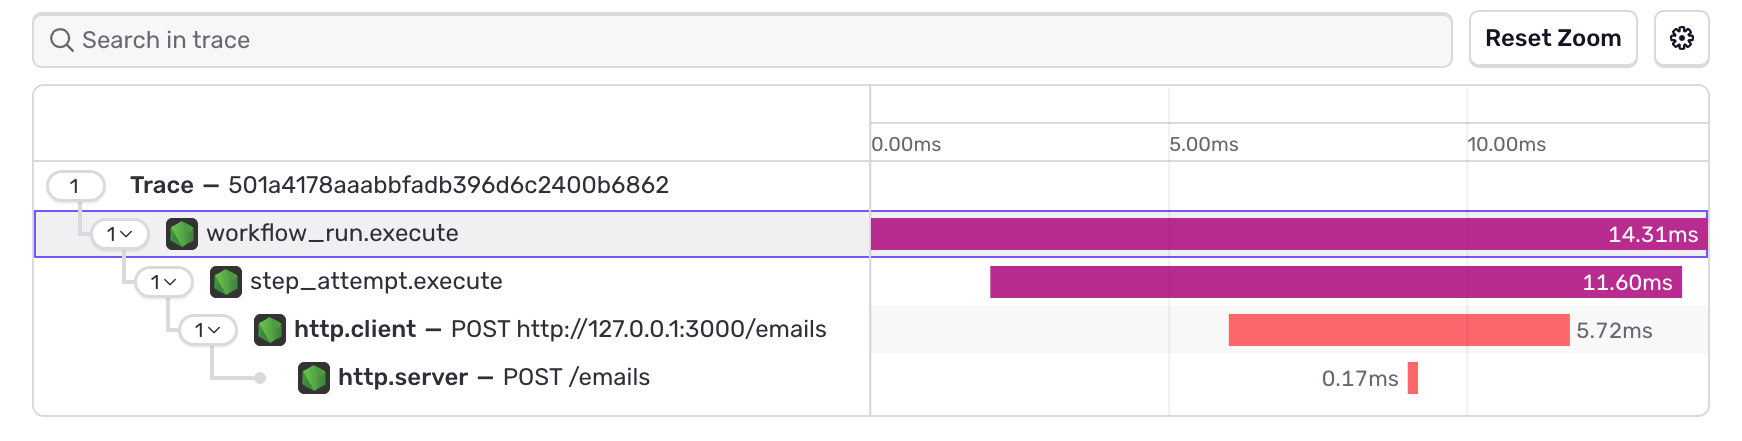
You can use Sentry to see what happens during a workflow run: which steps ran,
how long they took, and where they failed. OpenWorkflow already emits
[OpenTelemetry spans](/docs/opentelemetry), so the setup connects your existing
OpenTelemetry provider to Sentry.
 ## 1. Install
Install Sentry and the OpenTelemetry packages it needs:
```bash theme={null}
npm install @sentry/node-core @opentelemetry/api @opentelemetry/exporter-trace-otlp-http @opentelemetry/sdk-trace-base
```
## 2. Connect Sentry
In your existing `instrumentation.ts`, add these imports and call
`Sentry.init()` after starting your OpenTelemetry provider (`sdk.start()`):
```ts theme={null}
import * as Sentry from "@sentry/node-core/light";
import { otlpIntegration } from "@sentry/node-core/light/otlp";
Sentry.init({
dsn: process.env["SENTRY_DSN"],
integrations: [otlpIntegration()],
});
```
This adds Sentry as another destination for your spans. Your existing exporters
and sampling settings still apply. See Sentry's
[OTLP integration guide](https://docs.sentry.io/platforms/javascript/guides/node/install/lightweight/#using-with-opentelemetry-otlp)
for more options.
## 3. Start your app
Set your Sentry project's DSN and load the instrumentation before your app.
For TypeScript with `tsx`:
```bash theme={null}
SENTRY_DSN='' npx tsx --import ./instrumentation.ts index.ts
```
If your app and worker run in separate processes, load the instrumentation in
both. You can pass the DSN as shown above; you don't need a `.env` file.
During shutdown, stop the worker and await `sdk.shutdown()` to flush spans, then
await `Sentry.close(5000)` to flush Sentry events.
## 4. View a workflow run
Run a workflow, then open Sentry's Traces view. Filter by `openworkflow.run.id`
using your run's ID. You'll see spans for creating the run, executing it, and
running each step callback. Failed attempts stay marked as errors even when a
retry succeeds.
Sleeps and retries create separate execution traces. Each one links back to the
run's creation span. See [Trace relationships](/docs/opentelemetry#trace-relationships)
for how these fit together.
To try a complete setup, follow the
[OpenTelemetry example](https://github.com/openworkflowdev/openworkflow/tree/main/examples/opentelemetry).
It starts a workflow from an HTTP request, calls a fake email endpoint, sleeps,
and retries a failed step.
## 1. Install
Install Sentry and the OpenTelemetry packages it needs:
```bash theme={null}
npm install @sentry/node-core @opentelemetry/api @opentelemetry/exporter-trace-otlp-http @opentelemetry/sdk-trace-base
```
## 2. Connect Sentry
In your existing `instrumentation.ts`, add these imports and call
`Sentry.init()` after starting your OpenTelemetry provider (`sdk.start()`):
```ts theme={null}
import * as Sentry from "@sentry/node-core/light";
import { otlpIntegration } from "@sentry/node-core/light/otlp";
Sentry.init({
dsn: process.env["SENTRY_DSN"],
integrations: [otlpIntegration()],
});
```
This adds Sentry as another destination for your spans. Your existing exporters
and sampling settings still apply. See Sentry's
[OTLP integration guide](https://docs.sentry.io/platforms/javascript/guides/node/install/lightweight/#using-with-opentelemetry-otlp)
for more options.
## 3. Start your app
Set your Sentry project's DSN and load the instrumentation before your app.
For TypeScript with `tsx`:
```bash theme={null}
SENTRY_DSN='' npx tsx --import ./instrumentation.ts index.ts
```
If your app and worker run in separate processes, load the instrumentation in
both. You can pass the DSN as shown above; you don't need a `.env` file.
During shutdown, stop the worker and await `sdk.shutdown()` to flush spans, then
await `Sentry.close(5000)` to flush Sentry events.
## 4. View a workflow run
Run a workflow, then open Sentry's Traces view. Filter by `openworkflow.run.id`
using your run's ID. You'll see spans for creating the run, executing it, and
running each step callback. Failed attempts stay marked as errors even when a
retry succeeds.
Sleeps and retries create separate execution traces. Each one links back to the
run's creation span. See [Trace relationships](/docs/opentelemetry#trace-relationships)
for how these fit together.
To try a complete setup, follow the
[OpenTelemetry example](https://github.com/openworkflowdev/openworkflow/tree/main/examples/opentelemetry).
It starts a workflow from an HTTP request, calls a fake email endpoint, sleeps,
and retries a failed step.