1. Install
Install Sentry and the OpenTelemetry packages it needs:2. Connect Sentry
In your existinginstrumentation.ts, add these imports and call
Sentry.init() after starting your OpenTelemetry provider (sdk.start()):
3. Start your app
Set your Sentry project’s DSN and load the instrumentation before your app. For TypeScript withtsx:
.env file.
During shutdown, stop the worker and await sdk.shutdown() to flush spans, then
await Sentry.close(5000) to flush Sentry events.
4. View a workflow run
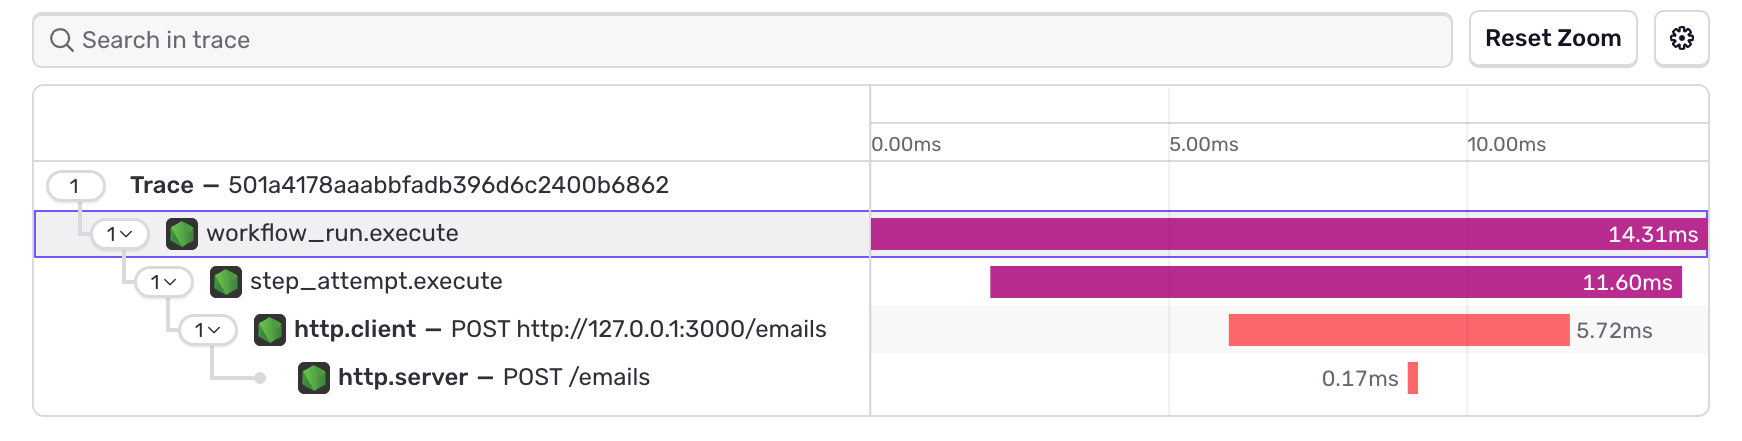
Run a workflow, then open Sentry’s Traces view. Filter byopenworkflow.run.id
using your run’s ID. You’ll see spans for creating the run, executing it, and
running each step callback. Failed attempts stay marked as errors even when a
retry succeeds.
Sleeps and retries create separate execution traces. Each one links back to the
run’s creation span. See Trace relationships
for how these fit together.
To try a complete setup, follow the
OpenTelemetry example.
It starts a workflow from an HTTP request, calls a fake email endpoint, sleeps,
and retries a failed step.